Assay Development
ATUM has extensive in-house assay capabilities, including mass spectrometry, HPLC, fluorescence, surface plasmon resonance (Bruker Sierra Pro), and bio-layer interferometry (ForteBio Octet Red384 and HTX Systems).
We can transfer your existing assays, or develop new assays to support your project. If you have a specialized assay that needs to be performed by you or a 3rd party, we will work with you to develop appropriate procedures for material and data transfer.
Functionality
Antibody Affinity
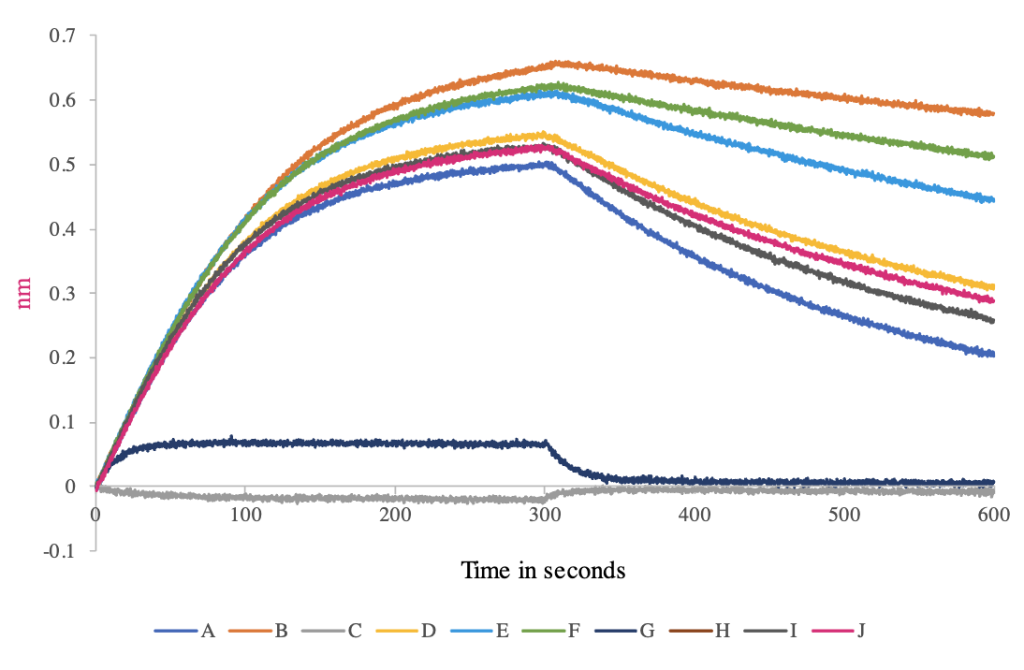
Antigen-antibody interactions are non-covalent and reversible, formed by a combination of hydrogen bonds, hydrophobic interactions, electrostatic and van der Waals forces. We can measure antibody affinity, i.e. the strength of the interaction between an epitope and an antibody’s antigen binding site by ELISA or by using our Octet BLI Biosensors system. Our Octet systems provide the ability for kinetic characterization. Antibody affinity for an IgG measured with our Octet system is shown.
The figure below shows an affinity screen with full kinetic characterization of Fab-ligand interaction. Antigen was covalently cross-linked to the Octet sensor via an amine linkage. Antigen coated sensors were placed into a Fab solution at a defined concentration for 300 seconds. Binding of the Fab to the antigen on the tip resulted in an increase in the Octet signal, which was proportional to the amount of Fab bound. The sensors were then moved to buffer for 300 seconds and the dissociation of the Fab from the antigen was measured by a decrease in Octet signal as the Fab fell off the tip. The ratio of dissociation rate (koff) to association rate (kon) gives an estimate of the dissociation constant (Kd) as a measure of antigen-antibody affinity.
Enzyme Specificity
One of the properties of enzymes that makes them so important is the specificity they exhibit relative to the reactions they catalyze. Traditionally, we support enzymatic specificity studies with different substrates performing individual kinetics measurements using fluorescence spectroscopy. We can also multiplex this approach using electrospray ionization mass spectrometry to quantify multiple products simultaneously. If the specificity of an enzyme does not meet the requirements needed, we can improve this attribute using our proteinGPS technology.
ATUM was asked to engineer a one-substrate enzyme into an enzyme active against 4 substrates. We discovered several homologs with significantly increased activity against all 4 substrates. Enzyme specificity against the 4 substrates was measured as a continuous kinetic colorimetric readout using absorption spectroscopy.
Enzyme Activity
Enzyme activity is a measure of catalytic ability over time, measured by the decrease in a substrate concentration or an increase in product concentration. We can measure the course of an enzymatic reaction by absorption and fluorescence spectroscopy.
Enzyme activity against 4 substrates was measured as a continuous kinetic colorimetric readout using absorption spectroscopy.
Developability / Stability
Expression
ATUM has extensive experience in optimizing the soluble expression of proteins in mammalian, bacterial and yeast hosts. We have an extensive catalog of vectors and vector elements that can be used to express a protein at the desired levels and in specific cell types. We can develop or provide expression vectors particular to your defined need. In conjunction with our codon optimization tools, we offer unparalleled opportunities to express your proteins at desired levels in your chosen host or cell type.
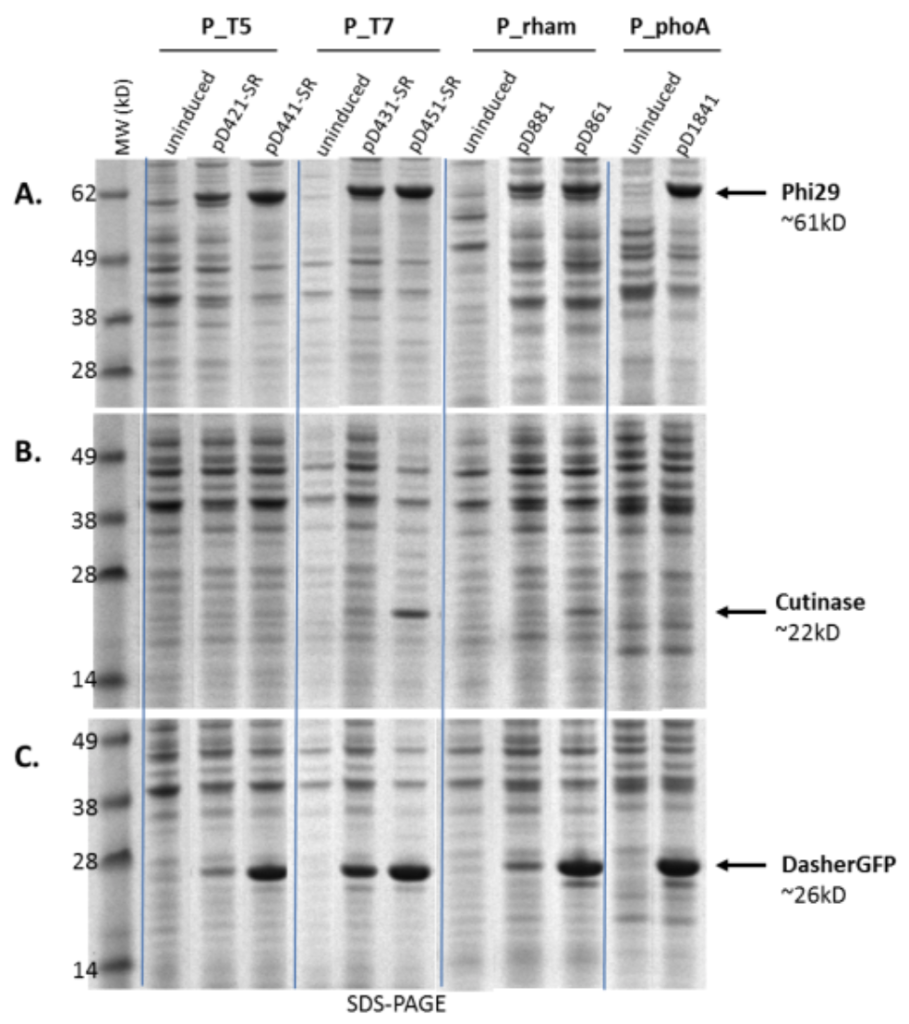
Different promoters work better for different proteins. Expression of three proteins, phi29 (~61 kD), cutinase (~22 kD) and DasherGFP (~26 kD), under control of different promoters, T5 and T7 (IPTG-inducible), rham (rhamnose-inducible) and phoA (inducible by phosphate starvation) is shown on an SDS-PAGE gel.
Solubility
The solubility of proteins is determined by various interactions including protein-protein, protein-water, protein-ion, and ion-water. The extremes of protein solubility can range from almost complete insolubility to several hundred of milligrams per milliliter. We can test the solubility of a protein by measuring the protein concentration in solution after centrifugation. Further testing also includes HPLC-SEC to determine whether the protein has started to aggregate, when testing whether high concentrations of the protein are soluble, and SDS-PAGE analysis to determine if the protein has degraded. Strategies for increasing in vitro protein solubilities include studying which buffers or additives can stabilize a protein, which we study using a thermal shift assay. Alternatively, it is possible to increase protein solubility using our ProteinGPS approach, replacing surface hydrophobic residues with hydrophilic residues or fusing highly soluble peptides or proteins to the target protein.
Soluble protein expression using different solubility tags is protein dependent. Three proteins encoded by genes A (~48 kD), B (~49 kD) and C (~59 kD) with solubility problems were expressed in E.coli expression vectors (pD441-XXX) with various N-terminal solubility tags MBP (~42 kD), GST (~26 kD), PpiBT (~19 kD), Fh8 (~8.8 kD) and 6XHis as a negative control (~1 kD) under control of the IPTG-inducible T5 promoter, at 37°C and room temperature (RT). Higher soluble protein expression was observed at RT except for gene A with MBP tag. BL21 cells were transformed and grown at 37°C in 2 ml LB + 30 µg/ml kanamycin to an OD600 of 0.8. Cultures were induced by addition of 1mM IPTG and incubated for 3 hrs at 37°C or overnight at room temperature (RT); uninduced cultures were run as negative controls. Samples were pelleted, lysed and total and soluble preps prepared. Total protein (T) samples and soluble fractions (S) were denatured and reduced in sample buffer with reducing agent at 95°C for 10 minutes. 5µl (approx. 5 O.Ds) of denatured sample was loaded per lane of a 4-12% NuPAGE Bis-Tris MES gel and Coomassie stained. Band volumes (shown in red boxes) were measured and quantitated using BSA as a reference.
Aggregation
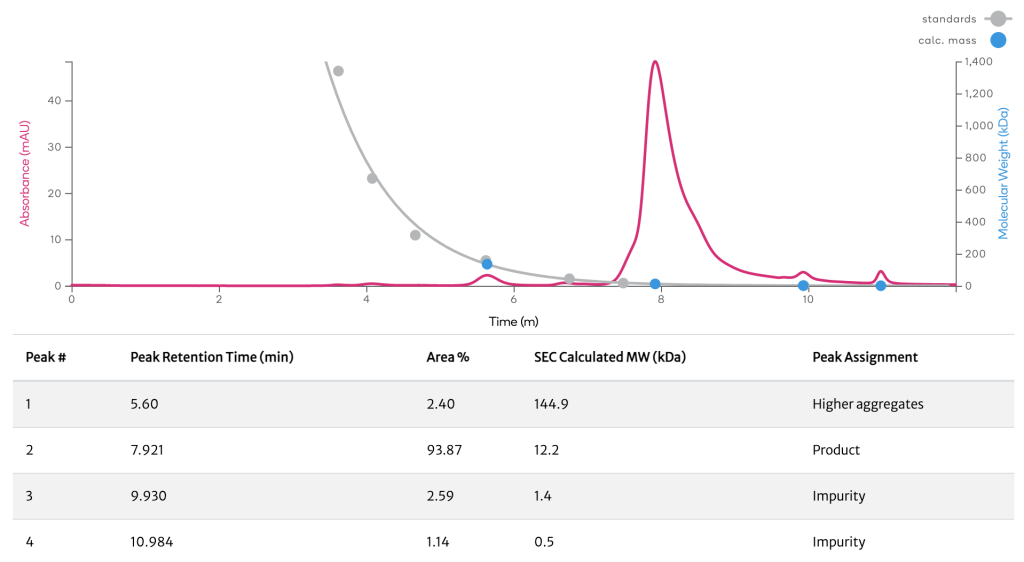
Aggregates are typically large, tangled clusters of denatured protein molecules that are irreversibly formed either during product expression in cell culture, product purification in downstream processing, or storage as drug substance or drug product. Our HPLC-SEC assay allows for aggregation formation to be monitored throughout our process which can be addressed by removal during purification. If a protein aggregates excessively we can use our ProteinGPS engineering technology to optimize the ability of the protein to stay in a monomeric state while maintaining function.
A cytokine was purified using a single-step purification method, and desalted into an appropriate formulation buffer prior to being run on a HPLC-SEC column. The UV trace from the cytokine product shows multiple peaks corresponding to the product, impurities and possibly higher aggregates.
Stability
Protein Stability is the balance of forces that determine whether a protein is in its native folded conformation or a denatured (unfolded or extended) state. A common goal is the creation of an environment in which protein samples can stably retain native conformations.
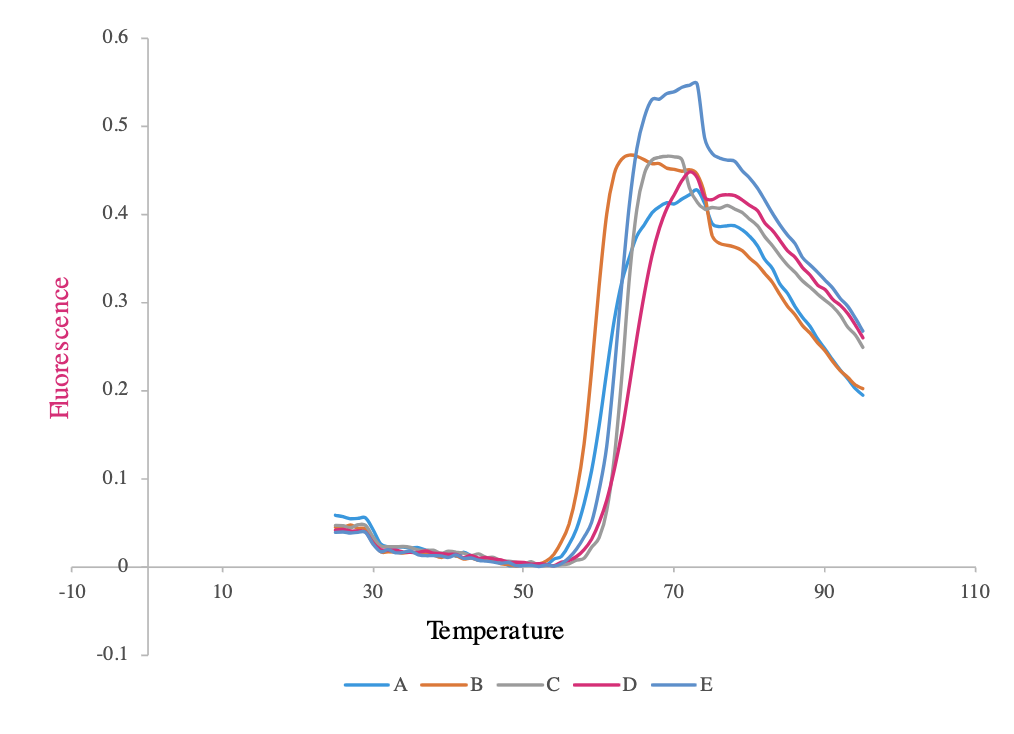
Tm is the protein’s melting temperature and is a reporter of the protein’s thermal stability. We use differential scanning fluorimetry (DSF), a thermal shift assay that uses a fluorescent dye to monitor the temperature-dependent unfolding of a protein or the denaturation temperature performed on a quantitative PCR system as a high throughput screen. This can be used to screen conditions that affect protein thermal stability, such as protein mutations, ligand binding, and buffer formulations (for example pH, salts, detergents and other additives). The example shows Tm measurements for a subset of variants from a 96 protein variants screen.
Post-translational modifications
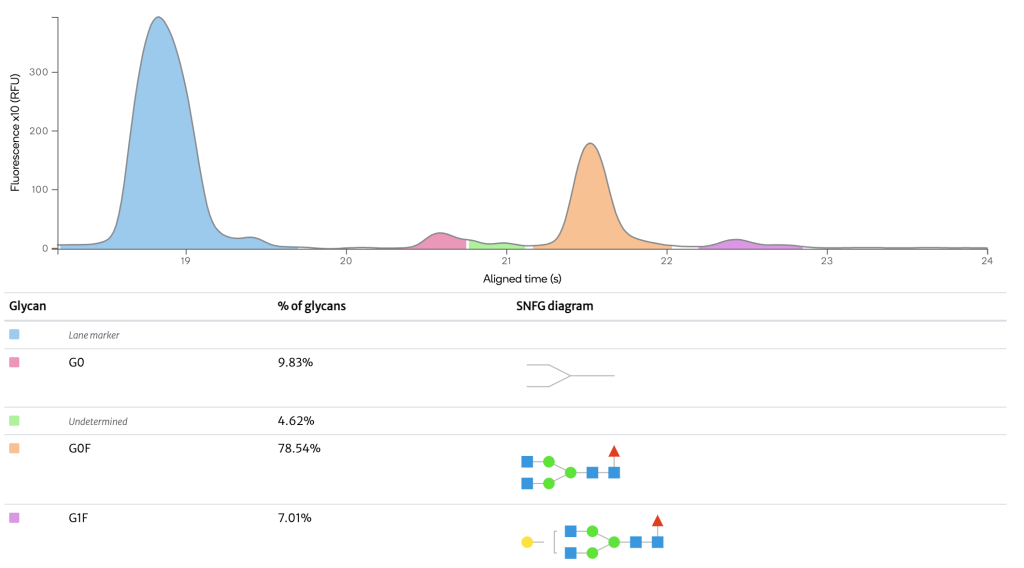
Many biological therapeutics being developed today have or are at risk from potential Post-Translational Modifications (PTMs). These structural protein modifications are relevant to determining a molecule’s overall long-term stability, safety, and efficacy. Our HPLC, Mass Spectrometry and micro CE systems provide the ability to study charge, hydrophobic and glycan variants. Furthermore, we can determine the mass of the molecule, and by peptide mapping determine the location of each modification.
The glycosylation profile of a therapeutic mAb was measured using micro CE. The microchip-based CE analysis provides sufficient resolution to determine the relative abundance of the major N-glycan types found on antibodies, offering a high-throughput option.
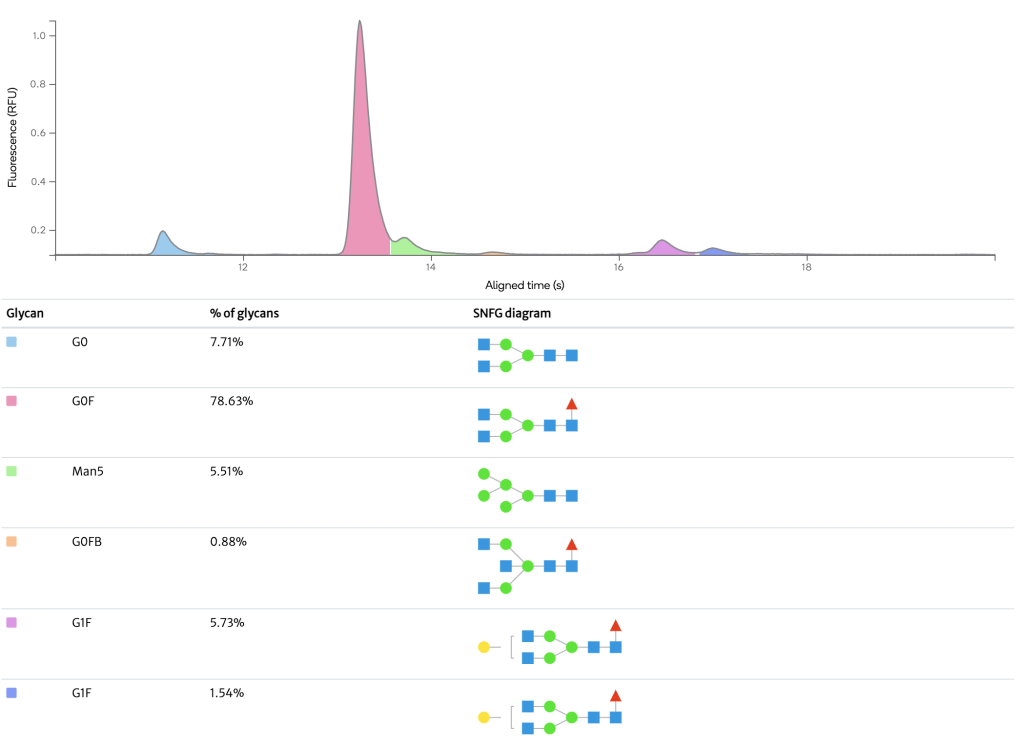
µCE / Glycan analysis Herceptin
N-glycosyation of therapeutic proteins can be monitored by the enzymatic N-glycan release followed by labeling with a fluorescent tag to run HILIC-FLD analysis. The FLD chromatogram is of a N-Glycan sample from the mAb Herceptin showing detection of major and minor glycans. The relative abundance of each glycan is shown in the table.
µCE / Charge Variant Herceptin
Microchip based CE was used to determine the charge profile of mAb Herceptin. The profile of this particular mAb includes two basic variants, one main variant and three acidic variants. The resolution of the assay is sufficient to determine the relative abundance of each variant.
